When a simulation has started, data structure is created and is being filled with information from the current simulation. Remembering the data structure, we can work with it as elements of a vector. Each element is a snapshot, and each snapshot has a lot of information, some of them can be seen as new vectors.
Two ways are available to see simulation results: text and graphic mode.
Use Data browser in order to access data values. First of all, please click on "Snapshots" in the results tree. By using the vector treatment section, you can choose the snapshot whose information you want to access to. In the example shown, simulation has yielded 9 snapshots.
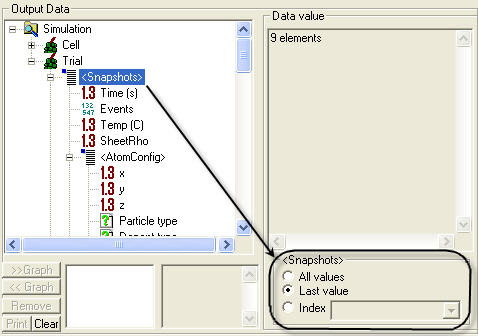
Once selected, you can click on any element of
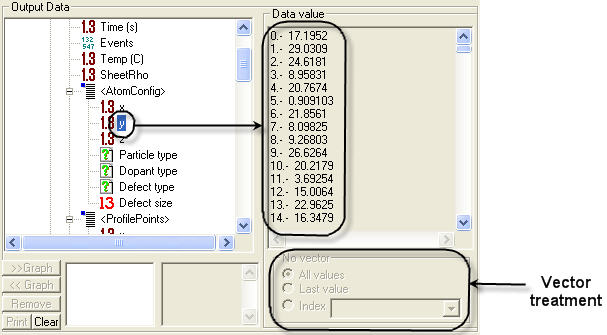
the snapshot. Please notice that some elements can be vectors, in whose case,
this symbol will appear: ![]() . In this
case, you can select new elements from these vectors, in an iterative way.
. In this
case, you can select new elements from these vectors, in an iterative way.
Most of times, it is much better to see graphics in order to analyse better the results. Every element from data structure can be graphically represented. Basically, two types of graphics are implemented in UVAS:
2D Graphs: Used for representing profiles in one dimension (depth, x), concentrations versus time, etc.
3D Graphs: Used for representing atomic profiles.
Click here in order to know how to plot generic data in UVAS.
Sometimes, it might be useful to have the results of a simulation in a text file. For doing this (see figure below):
Click on the series to save in the Series Selector.
Click on ">> Graph" in the Data Printer. You will see the series title in the box next to the button.
Click on "Print" and you will get the results in a text mode.
Select all the text by right clicking and copy it into a file.
"Clear" button is used to erase the content shown in the box whereas "Remove" eliminates the series in the Data Printer.
![]()