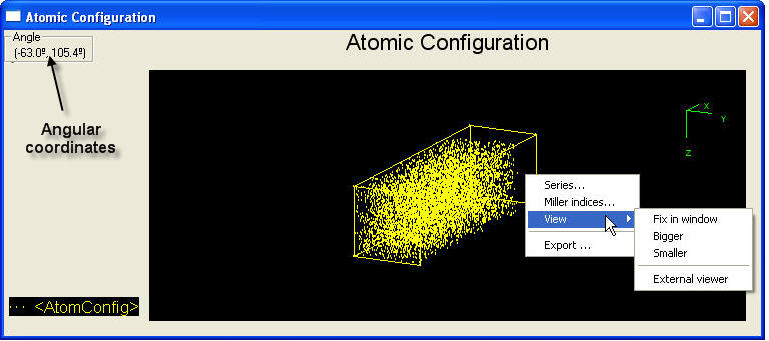
3D graphs in UVAS is basically used to plot atomic configuration in the simulation box. Its general appearance is shown below:
As can be seen, only interesting elements are plotted (point defects, dopants,...) according to atomistic simulation principles. Coordinates are shown by both angles on the top left corner and by cartesian axis on the top right. If you click on the draw area and keep pushed, you can move the box and therefore change the angle of view.
Many of the available options are the same as in 2D Graphs, and can be checked here. By right clicking, on access a sub-menu with these options:
Series...: Opens series selector.
Miller indices...: Changes miller indices.
View...:
Bigger and Smaller: Changes the size of the box.
Fix in window: It is the autoscale option.
External viewer.
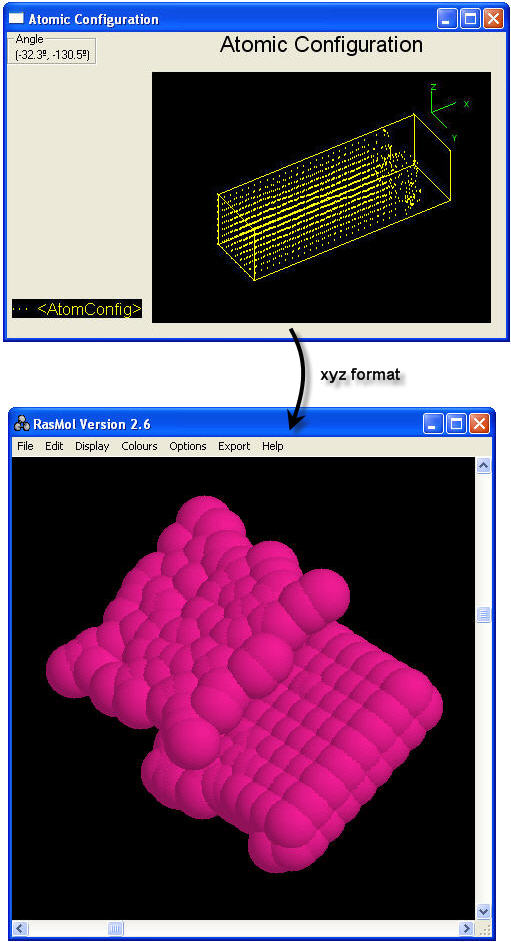
Export...: Creates files with different formats (GIF, PNG, EPS,...). One of the most useful one is the xyz format, because it generates a file which can be opened with RASMOL. Figure below shows an example of this: