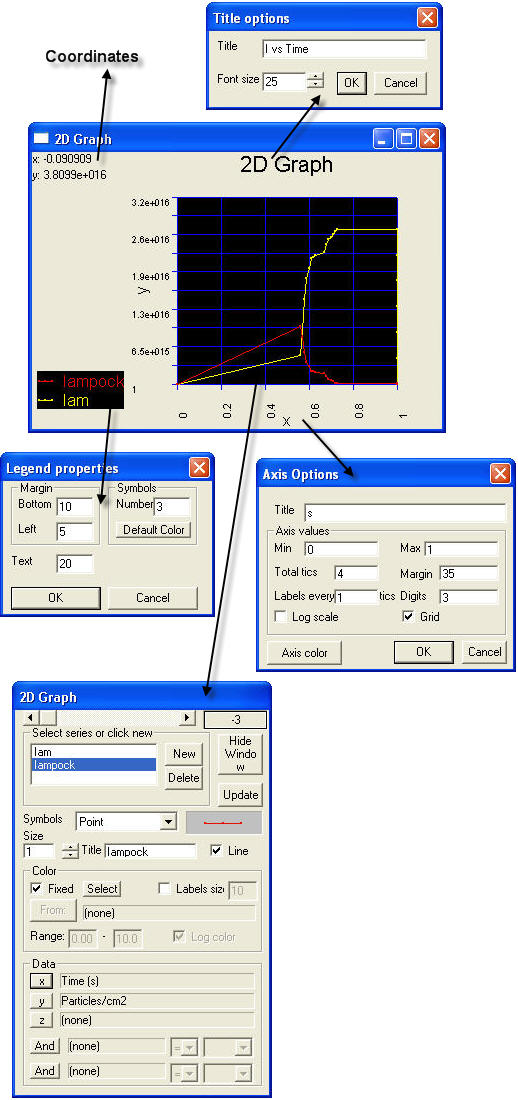
2D graphs UVAS implementation has an appearance as shown:
XY coordinates change automatically only my moving the mouse cursor onto the graph area.
Subwindows appear by double-clicking on the indicated areas of the 2D graph window.
Title options: Both title and font size can be changed.
Legend properties:
Text: Size of text.
Number of symbols: Number of symbols in the legend. They represent values from simulation in the graph.
Axis options (valid for both abscissas and ordinates axis):
Title.
Axis values: You can limit the axis values and setting tics for it. Log scale and grid are also available in UVAS.
Series selector: This is the most important part of UVAS graphics. Here is where UVAS is indicated what to draw. In terms of appearance, you can set here the title for each series, and the symbols and sizes employed. If you want to learn how to plot results, please click here.
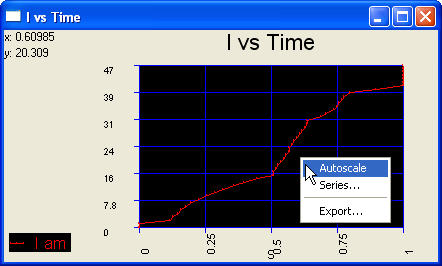
If you right click on the draw area, you will find interesting options:
Autoscale: Automatically adjusts axis to their minimum and maximum values.
Series...: Opens series selector.
Export...: Creates files with different formats (GIF, PNG, EPS,...).