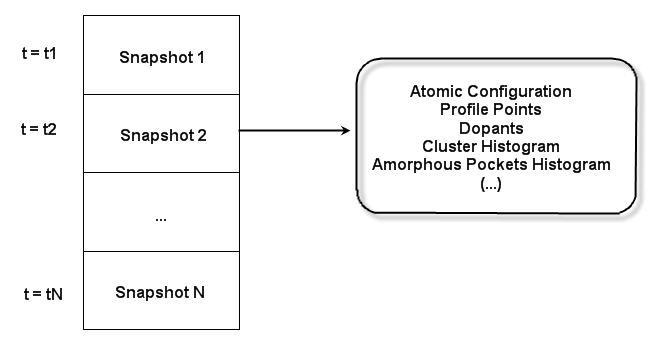
At certain moments during the simulation, UVAS collects all the information about it and saves it. This is called a snapshot. Data structure are then build by snapshots, which can be seen as vector elements:
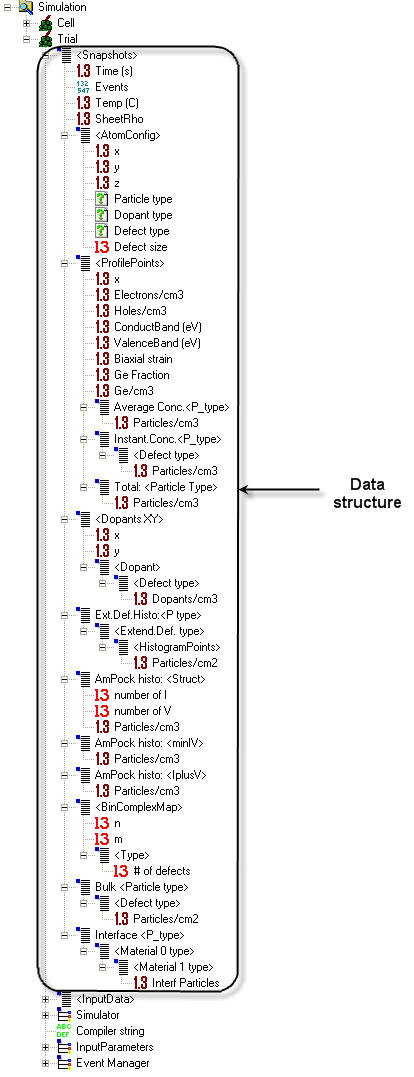
In each snapshot, you can find a lot of information about the current simulation. These data include:
Time (in seconds).
Number of events occurred.
Temperature (in degrees centigrade ).
SheetRho: Sheet resistance (in ohms).
Atomic Configuration:
Profile points: A plot of profiles along the x axis. The number of points shown is defined by the command Set_Output_Options. Some data are shown here:
x: Depth.
Conduct and valence band energies in eV.
Biaxial strain: Lattice parameter deviation from the silicon standard. [TO BE DEVELOPED]
Ge fraction. [TO BE DEVELOPED]
Ge per cm-3. [TO BE DEVELOPED]
Average concentration: Concentration of mobile particles (interstitials and vacancies, either single or associated with a dopant). As it is difficult to get these particles in each snapshots, UVAS makes a time average by counting the hops. If there are no hops (immobile particles or too low temperature or too short time between snapshots) this average concentration will not be reliable.
Instantaneous concentration of different particle types: Concentration of immobile particles.
Total number of particle types. The sum of the last two parameters.
Dopants XY, dopants concentration distribution in XY plane, including information listed:
Position in the simulation box.
Defect type: See defects.
Extended defect histogram gives full information about I or V in amorphous pockets, I311, dislocation loops and voids.
Amorphous pockets histogram (structure) provides with information about the number of interstitials and vacancies in amorphous pockets and its concentration.
Amorphous pockets histogram (min(I,V)) gives the concentration of the number of interstitial-vacancy pairs in amorphous pockets.
Amorphous pockets histogram (I+V) gives the concentration of the total number of interstitials and vacancies in amorphous pockets.
Binary complex map collects information about complexes during process, such as interstitials with B or C, or vacancies with As, F, O or P.
Bulk shows the concentration of particles in amorphous pockets, complexes, dislocation loops, 311 clusters, platelets, point defects, Si interfaces, interstitials supersaturation and voids in the bulk.
Interface stores the number of particles in the interface between material 0 and material 1.
Data structure can be accessed through Data browser in UVAS interface: