This simulation shows the evolution of the total insterstitial density in {311} defects as a function of annealing time. A 40 KeV Si implant onto Si with a dose of 5 x 1013 cm-2 and a dose rate of 1 x 10¹² ions cm-2 s-1 is performed. Then, anneal begins with a ramp of 7 s and has a total duration of 100000 s. Evolution of amorphous pockets and {311} defects during this post-implant anneal is discussed.
A name must be assigned to Object Name and Client Data.
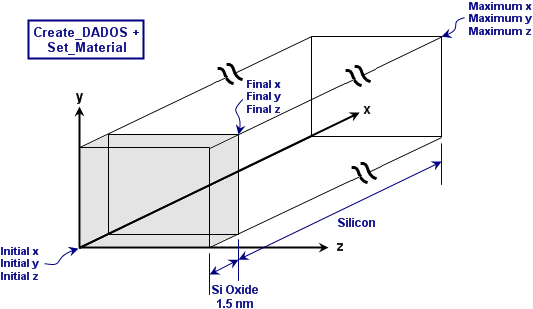
Maximum x: 400 nm
Maximum y: 150 nm
Maximum z: 150 nm
The values of the parameters Minimum x, Minimum y and Minimum z must be zero.
Material: SiOxide
Initial x: 0
Initial y: 0
Initial z: 0
Final x: 1.5 nm
Final y: 10000 nm
It is important to point out that the values of Final y and Final z are greater than the values of Maximum y and Maximum z in Create_DADOS command. In this way, the new material layer fits the previously defined simulation box. In this case, a thin layer of Silicon Oxide with a thickness of 1.5 nm on top of the Si is included.
After these two commands, the following simulation box has been created:
This comand is used for visualization purposes. UVAS introduces experimental data (Eaglesham et al., 1994) from a DA2IN file in order to compare them with the simulation results.
Start Output Time (s): 1 s
Snapshots per Decade: 10
UVAS starts the graph structure defined in the GPH file. As the simulation proceeds, UVAS takes different snapshots and the results are plotted on the screen.
Implant species: Silicon
Energy (keV): 40 keV
Tilt: 7°
Rotation: 45°
Dose: 5 x 1013 cm-2
Dose rate: 1 x 10¹² ions cm-2 s-1
Target Structure: Crystal
Initial Temperature: 26.85 °C
Final Temperature: 705 °C
Initial Temperature: 705 °C
Final Temperature: 705 °C
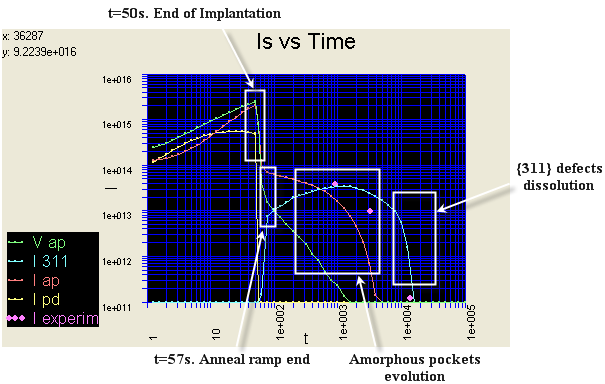
In this simulation, there occur some interesting processes. During self-silicon implant, interstitial concentration is continuously increasing. When Si implant ends and anneal ramp begins, there are several changes in the concentrations of amorphous pockets (APs) and interstitial point defects. Next, amorphous pockets start to transform in {311} defects and at the end of anneal ramp, the concentration of this type of defects has already risen considerably. During anneal, extended defects are dissolved: first, amorphous pockets and finally, {311} defects.
Indeed, there are also two other important topics in this simulation which are interesting to gain knowledge of defects behaviour. The first one is interstitials and vacancies supersaturation and the last one is the evolution of amorphous pockets size.
Simulation evolution is shown in the following graph, where the main events are enhanced.
The simulation can be divided in the following moments:
First, point defects (interstitials and vacancies) are generated. Between consecutive cascades, some of these point defects form amorphous pockets. At the end of the implantation, most of the Is and Vs are in these amorphous pockets. At that moment, most of the amorphous pockets are small.
In the two following graphics it is shown the evolution explained.
The composition of these amorphous pockets at that moment can be seen in the next graph (AP histogram). Most of the amorphous pockets are small, and an important fraction of them are composed from interstitials and vacancies, other only by Is or Vs.

![]()
During the temperature ramp (from ambient to 705°C) the isolated Is and Vs (point defects) diffuses. Some of them reach the surface, where they disappear, and others find some existing amorphous pockets and bind to them. Besides, I-V recombination inside the APs increases, which causes the APs to become composed only from Vs or from Is.
Interstitials profile at the end of anneal ramp is shown in the next graph, where can be seen that all the Is are in APs.
![]()
There occur many changes in defects morphology throughout a high temperature annealing stage. First, AP Ostwald ripening process begins: less stable APs with high emision/capture ratio dissolve whereas the more stable ones grow. When these latest ones are high enough, they evolve into a more stable form of extended defects, the {311}, which are like rectangular stripes of interstitial along a <110> direction.
In summary, amorphous pockets are higher and higher, which causes most of them to become {311} defects. On the other hand, high temperature causes emission frequency grows, so amorphous pockets also dissolves and mobile point defects emitted by them are captured by surface. All this facilitates amorphous pockets dissolution.
Next graphs show this process. This first capture, made when the anneal ramp ends, shows the small sizes of the APs. No {311} has been already formed.
In the second picture (made at 200 s.), the AP density has been reduced, there are no APs sizes smaller than 8, and some of the bigger ones have been converted in {311}s.
It is also interesting to study what occur with interstitials emitted by extended defects. The following graph (made at 200 s.) shows mobile point defect profiles. Once emitted, they diffuse towards the surface (x=0), where they disappear.
This last capture made at 200 s. shows interstitial profiles and how amorphous pockets dissolve while {311} defects grow. Next graph shows the same situation in three dimensions. There are almost the same concentration of amorphous pockets and {311} defects.
However, this situation changes later. Amorphous pocket concentration decreases until dissolution and {311} defects size increases due to the Ostwald ripening mechanism. The following figure shows changes produced at 3200 s.
![]()
When there are no APs left, a small number of big {311} defects grow at the expense of the small ones, until finally they also start to dissolve, by emission of interstitials. These interstitials travel up to the surface and there they disappear.
![]()
Supersaturation is defined as the
actual interstitial
concentration divided by equilibrium interstitial concentration. This parameter
is related to the behaviour of extended defects and in this case,
supersaturation helps to understand how defects dissolution is produced.
Supersaturation vs time graph is shown next, along with the Interstitials in defects vs time for comparison. During self-silicon implant, interstitial and vacancy concentration is increasing continuously and supersaturation is really high (time<50s). When anneal begins (time=50s), defect recombination makes supersaturation to decrease. While both APs and {311} defects are emitting interstitials, the supersaturation level is kept high (about 2·104 in the graph). Finally, the dissolution of the {311} defects make the supersaturation to decrease very quickly.
Moreover, it is interesting to enhance that vacancies in amorphous pockets are dissolved earlier than interstitials. This is due to the higher diffusivity of vacancies. They move faster and consequently, they are captured by surface in the early stages of the annealing.
![]()
Amorphous pockets size changes along the simulation. First of all, most of amorphous pockets are very small and they consist of vacancies and interstitials together. When anneal begins, Is and Vs are recombined, so amorphous pockets become self-vacancy or self-interstitial clusters. Then, amorphous pockets evolve into a more stable form, in other words, their size increases. Next graphs show this difference at the beginning of the simulation (anneal ramp end) and later, during the annealing process.
At the end of anneal ramp, there are a lot of APs, and most of them are really small (blue):
At 630 s, less amorphous pockets are left, but their size is much bigger (green, orange, yellow and red) than before:
Moreover, dissociation energy is closely related to stability. Amorphous pockets with 8 interstitials are the most stable ones and their dissociation energy is the highest one (Cowern et al. 1999). Apart from this "magic" number, in general, bigger amorphous pockets are more stable.
As previously stated, amorphous pockets are bigger and bigger as simulation advances, but it is interesting to study the behaviour of amorphous pockets whose size is 8. Because of their high stability, they are predominant during the simulation and they are the last to dissolve.
This histogram shows the situation at 630 s, as the previous graphic. There is a marked difference between amorphous pockets whose size is 8 and the rest.
The following graphs also demonstrate this for two moments, t=630 s. and t=1600 s.
![]()
![]() P. A. Stolk, H.-J. Gossmann, D.
J. Eaglesham, D. C. Jacobson, C. S. Rafferty, G. H. Gilmer, M. Jaraiz, J. M.
Poate. "Physical mechanisms of transient enhanced dopant diffusion in
ion.implanted silicon".
Journal of Applied Physics
81, 6031 (1997).
P. A. Stolk, H.-J. Gossmann, D.
J. Eaglesham, D. C. Jacobson, C. S. Rafferty, G. H. Gilmer, M. Jaraiz, J. M.
Poate. "Physical mechanisms of transient enhanced dopant diffusion in
ion.implanted silicon".
Journal of Applied Physics
81, 6031 (1997).
![]() D. J. Eaglesham, P. A. Stolk,
H.-J. Gossmann, and J. M. Poate. "Implantation and transient B diffusion in Si:
The source of the interstitials". Applied
Physics Letters
65, 18 (1994)
D. J. Eaglesham, P. A. Stolk,
H.-J. Gossmann, and J. M. Poate. "Implantation and transient B diffusion in Si:
The source of the interstitials". Applied
Physics Letters
65, 18 (1994)
![]() Cowern, N. E. B., Mannino, G.,
Stolk, P. A., Roozeboom, F., Huizing, H. G. A., van
Berkum, J. G. M., Cristiano, F., Claverie, A., and Jaraiz, M. "Energetics
of self-interstitial clusters in Si".
Physical
Review
Letters
82, 4460 (1999)
Cowern, N. E. B., Mannino, G.,
Stolk, P. A., Roozeboom, F., Huizing, H. G. A., van
Berkum, J. G. M., Cristiano, F., Claverie, A., and Jaraiz, M. "Energetics
of self-interstitial clusters in Si".
Physical
Review
Letters
82, 4460 (1999)